About 6,000 miles of highways are within the 1,700 sq. mile watershed of Jordan Lake. Highway trash is a major problem all over North Carolina. Each rainfall carries the litter into nearby streams that eventually feed into the main streams entering Jordan Lake. The question GIS can address is: how much trash does the highway network contribute to the total removed by volunteers at the shoreline?
The North Carolina Department of Transportation (NCDOT) has several programs to remove highway trash. The Adopt-A-Highway (AAH) program allows volunteers to select 2-mile sections to clean three times per year. The Sponsor-A-Highway (SAH) program relies on businesses and corporations to choose highway sections for advertising and provide funds to NCDOT to hire contractors for trash removal. The direct Contractor Program is a third way that NCDOT uses to remove trash on segments of high priority.
Ben Maxson worked together with Clean Jordan Lake and the NC DOT for his Capstone Project in the Master of Geospatial Information Science and Technology (MGIST) program at NCSU's Center for Geospatial Analytics in Spring 2021. You can view his 12 minute Zoom talk here:
Ben created a GIS mapping of highway trash in the Jordan Lake watershed in lb of trash per mile for the NC DOT SAH Program. He then developed a predictive tool to estimate the trash loading on the 85% of highways not yet adopted. Click here to check out his results.
Click on the Information icon at top left of the GIS map to get a link to the Users Guide.
From left to right on the top right of the GIS map are: Legend button to view how each visible layer is symbolized; Layer List button to toggle map layers on/off; and Basemap button to change the background image for the application (aerial photography, topography, etc.).
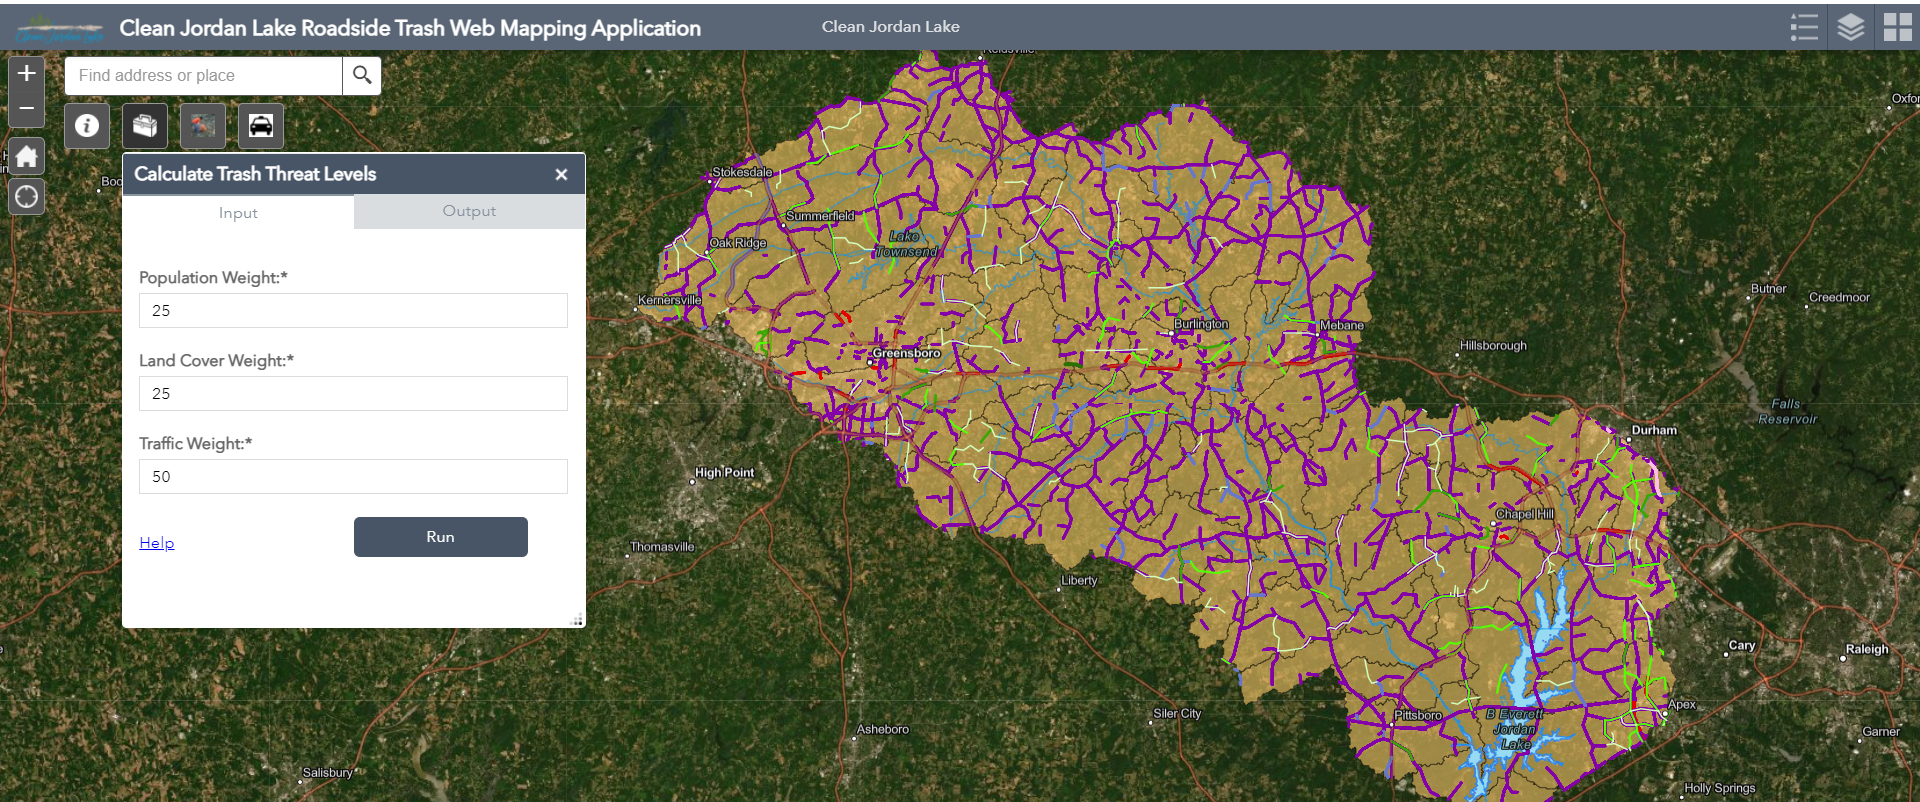
The Tool Box icon at the top left of the GIS map contains the Calculate Trash Threat Levels tool that accounts for Land Use; Population; and Daily Highway Traffic Volume . A percent weighting factor is assigned to each. Ben's default values are: 25% for Land Use, 25% for Population and 50% for Daily Highway Traffic Volume.
The highest numerical score for Threat Level would be in urban areas with largest populations on highway segments within them with the highest daily traffic volume. Ben divided the Threat Level scorings into four bins of from 1 (lowest) to 4 (highest).
The miles of highway for each Threat Level are:
Threat Level 1 = 6 mi.
Threat Level 2 = 253 mi.
Threat Level 3 = 5,249 mi.
Threat Level 4 = 156 mi.
Though still to be determined in a future project, suppose the current NC DOT database for highway cleanups shows 50 lb/mi. per year as roughly corresponding to Threat Level 3 highway segments. Multiplying by the 5,249 mi in this level gives an annual trash loading of 131 tons across the watershed.
The viewer of the GIS map is encouraged to change the percent weighting factors to see how they affect the Threat Level assigned to each highway segment. All percentages must add up to 100, and the resulting layer will overlay the hazards based on the weights assigned.
Hover the cursor over a specific section of highway in the AAH Program that appear in shades of green according to the intensity of the load in lb/mi. removed by volunteers form 2018 to 2020. A window appears to show the details of the cleanups, e.g., number of volunteers and bags of trash (1 bag=15 lb trash).
Use the Search Trash Cleanup Data tool (third icon on top left) to select minimum values for AAH pounds of trash collected per mile of roadway by setting the minimum lb/mile collected. Alternatively, search by road classification level (1-7) as explained in the User Guide.
The fourth icon on top left (vehicle) is used to look at he annual average daily traffic data collected by NC DOT in 2019. Alternatively, click on any highway segment on the map to see these data.
Bens' work will be the starting point for the next Capstone Project in Fall 2021. The goals will be to 1) add the SAH Program database; 2) correlate the Trash Threat Levels for each adopted highway segment to its trash loadings from NC DOT data; and 3) project trash loadings onto the highways not yet adopted according to their Trash Threat Levels. This will help Clean Jordan Lake to understand the amount of trash coming to the lake's shoreline from highways.
An equally important outcome of Ben's project is to increase the effectiveness of our Adopt-A-Feeder Stream Program. A GIS map layer showing the location of all streams in the watershed will be added. This is available from NC OneMap project. We will give highest priority for adoption to those streams near highways with the largest projected trash loading.