Viewing our HIstory of Trash and Tire Removal planning future cleanups
GIS mapPING TO visualize our accomplishments
Clean Jordan Lake has partnered with three graduate students in their Capstone Projects for the MS degree in the Center for Geospatial Analytics at North Carolina State University. In 2017, Sue King created our first GIS database of trash deposited by rainfall on the shoreline. She divided the shoreline into 45 small subsections along the Haw River Arm and upwards a few miles on the New Hope Channel where recreational trash is only a minor contributor. Click here to see her final product.
In Spring 2020, Kelsey Little developed the first version of a mobile app to enable our cleanup leaders to enter cleanup data and the length of shoreline while in the field.
How to estimate impact of rainfall on trash ?
At least two cleanups are needed along the same length of shoreline to measure the trash amount arriving with rainfall. The first cleanup establishes a clean state for the shoreline. The trash collected per 100 ft in the next cleanup is divided by the number of significant rainfalls between the first and second cleanups. Lake level rise is the surrogate measure of rainfall available online from the USGS gauging station in Moncure. The same method of calculation applies to subsequent cleanups.In Fall 2020, Laurel Krynock improved the phone app and the GIS database to quantify trash coming with rainfalls. Click here to watch her presentation of the project at the NCSU Geospatial Analytics Center and here to watch her short video about how to use the phone app.
Stormwater flushing of trash into the lake is related to rainfall. However, measurements at a single rain gauge do not capture the variation in intensity and duration over 1,300 sq. mi. of watershed. Lake level rise is a far better measure of stormwater because it represents the net effect of rainfall variability across the watershed. Laurel wrote code for data fetching from the online graph of lake level at the USGS Gauging Station at Jordan Lake to find the dates and corresponding heights of the lake above normal. The number of lake level rises (LLRs) and cumulative height of all LLRs between successive cleanups are retrieved from data fetching back to our first cleanup in 2009. The amount of trash per 100 ft of shoreline divided by the number of LLRs or the total height of all the LLRs are two ways of relating rainfall to the amount of trash deposited.
GIS focuses on the Haw River Arm from the entrance of Robeson Creek to the dam and both sides of New Hope River Channel from the dam northward to New Hope Overlook at Jordan Lake State Park.
About 20 mi. were cleaned at least once. This section was selected because the main source of trash and tires comes from stormwater flows from the Haw River watershed after rainfalls rather than recreational use of the lake. The shoreline length was divided into 45 small subsections to show spatial variability in intensity of trash and tires and in volunteer effort to remove it.The Clean Jordan Lake Trash Cleanup Web Mapping Application enables appreciation of the historical impact of trash on the lake’s shoreline. The User Guide explains how to use it.
Cleanup data stored on the Application cover 2009 to 2022. The Average Trash in lb/100 ft for each shoreline section is visualized by clicking on the Toolbox icon at the top left of the Application. Trash loading is averaged across all cleanups conducted at each subsection of shoreline.
The Legend icon at the top right of the Application was selected to show the values of trash associated with each circle size.
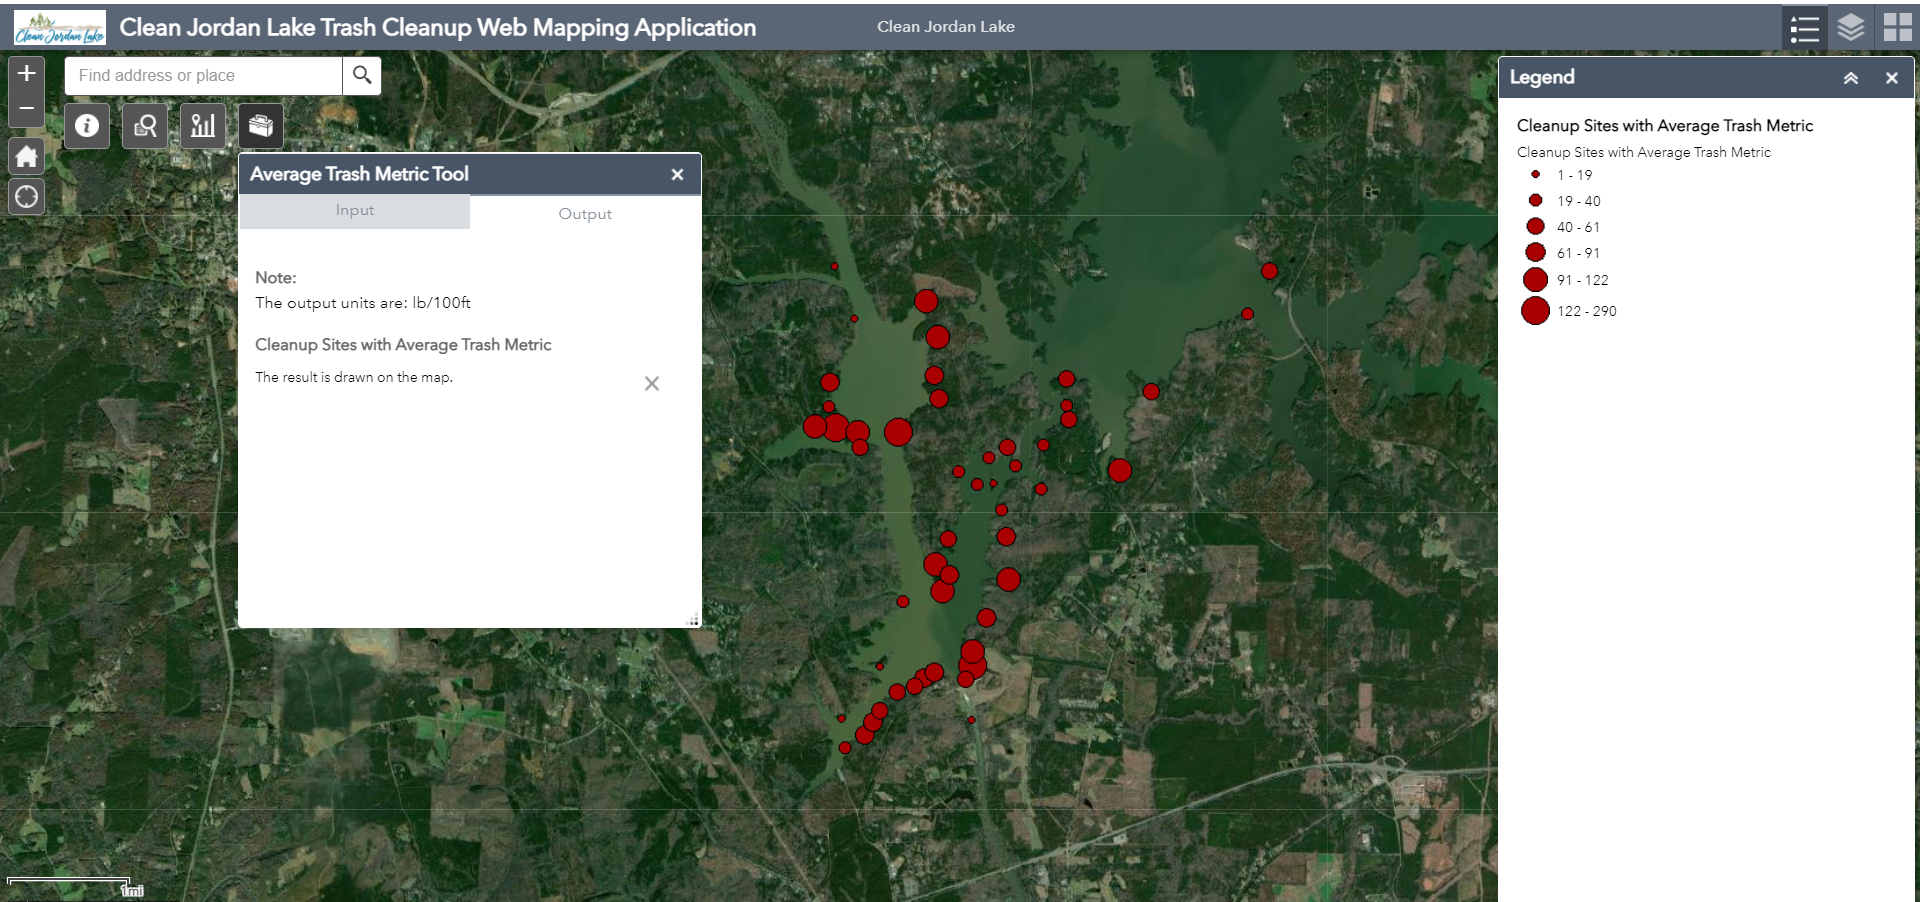
The Average Trash Metric Tool of lb/100 ft/LLR (no.) can also be selected from the Toolbox icon. Instead of number of LLRs, the cumulative lake level rise (CLLR) for all rainfalls between two successive cleanups can be selected. This takes into account the magnitude of each LLR and thus, the intensity-duration of rainfalls between successive cleanups.
The trash metrics are updated automatically each time data from a new trash cleanup at the site is entered either while at the site using the phone app or afterwards using the admin version of the Web Mapping Application,
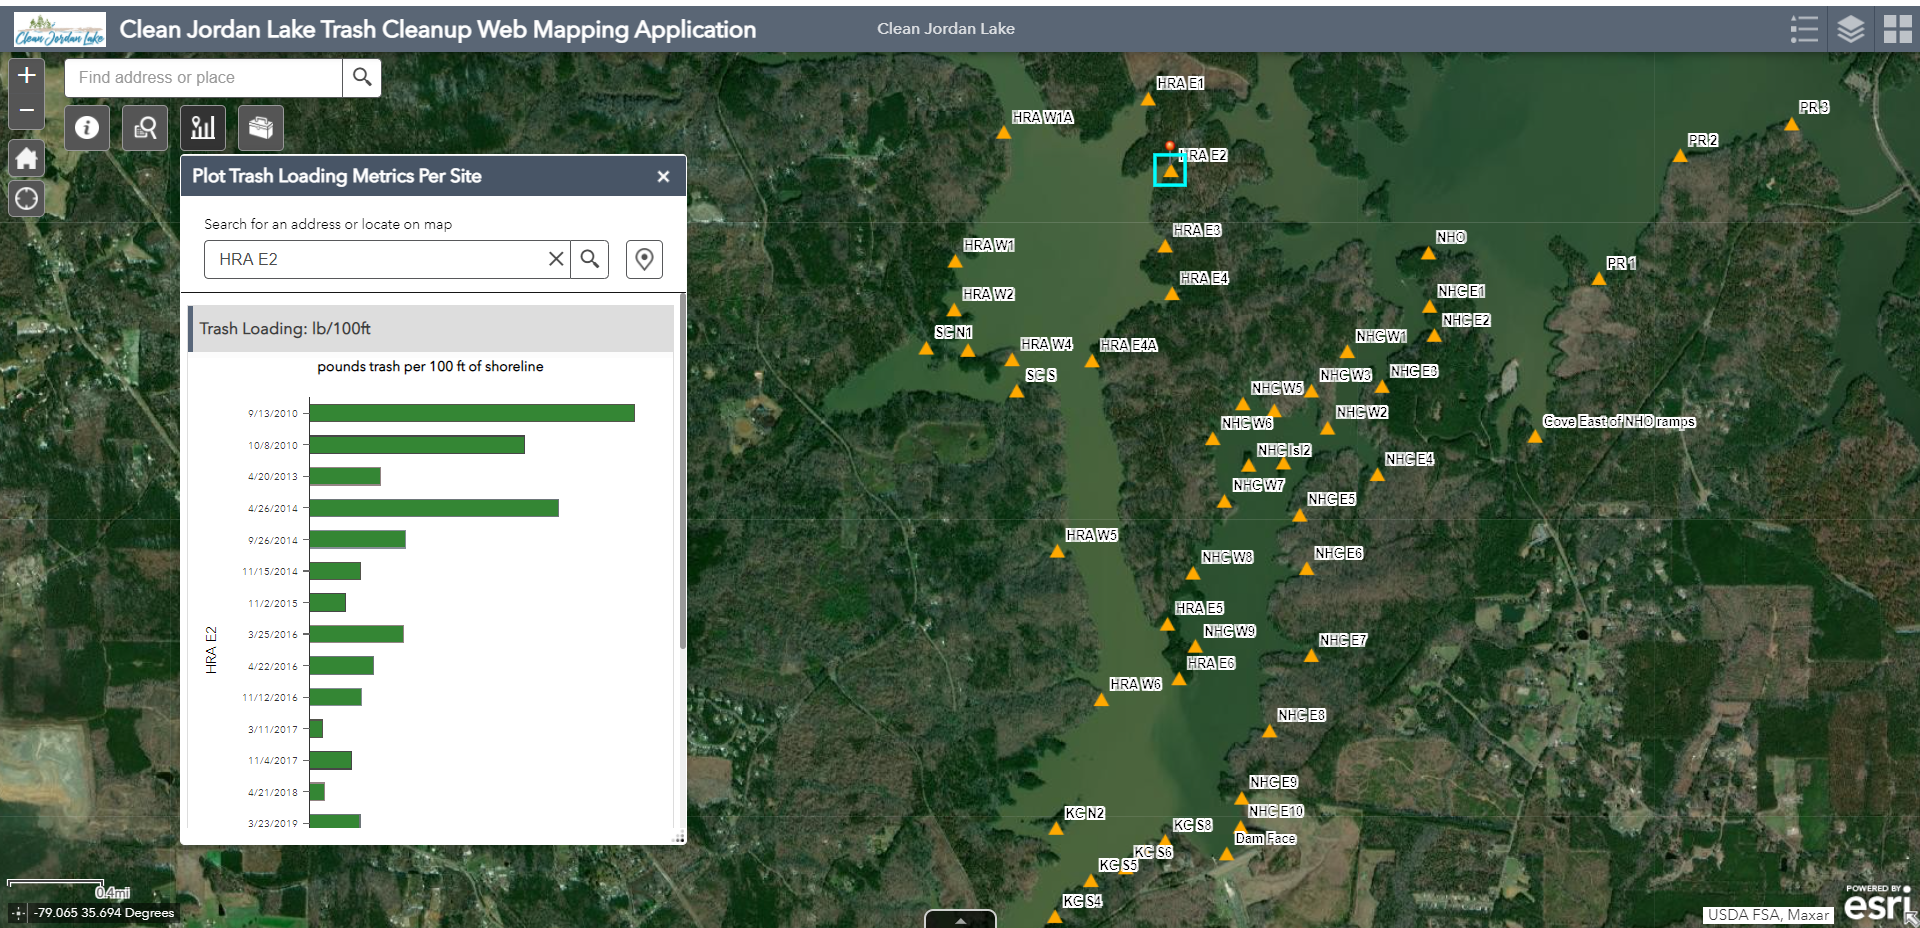
The public can also use the Web Mapping Application to view trash removed for each cleanup at each specific subsection of shoreline. The Bar Graph Icon is selected at the top left of the Application and a shoreline subsection is selected. For example, the mapping below shows results for subsection HRA E2 (Haw River Arm, east side). The yellow triangle within the blue rectangular outline is the midpoint of HRA E2. The general decline in trash loadings per 100 ft from the early years of cleanups is because our volunteers were faced with removing a legacy of 28 years of trash deposited since the lake had been filled in 1981. The loadings also vary from date to date because of the intervening number of rainfall events, i.e., the more rainfalls, generally the more trash.